
Introduction
Even with careful analytical processes and detailed documentation habits, a rare human error can slip through. This is a story about how a single typing mistake (the first of its kind in my analytical career) created temporary doubt, but ultimately confirmed the accuracy of my organized analytical approach. It's proof that a disciplined checking process can catch even small differences, and how maintaining high standards in analysis pays off.
The Analysis: September 5, 2025
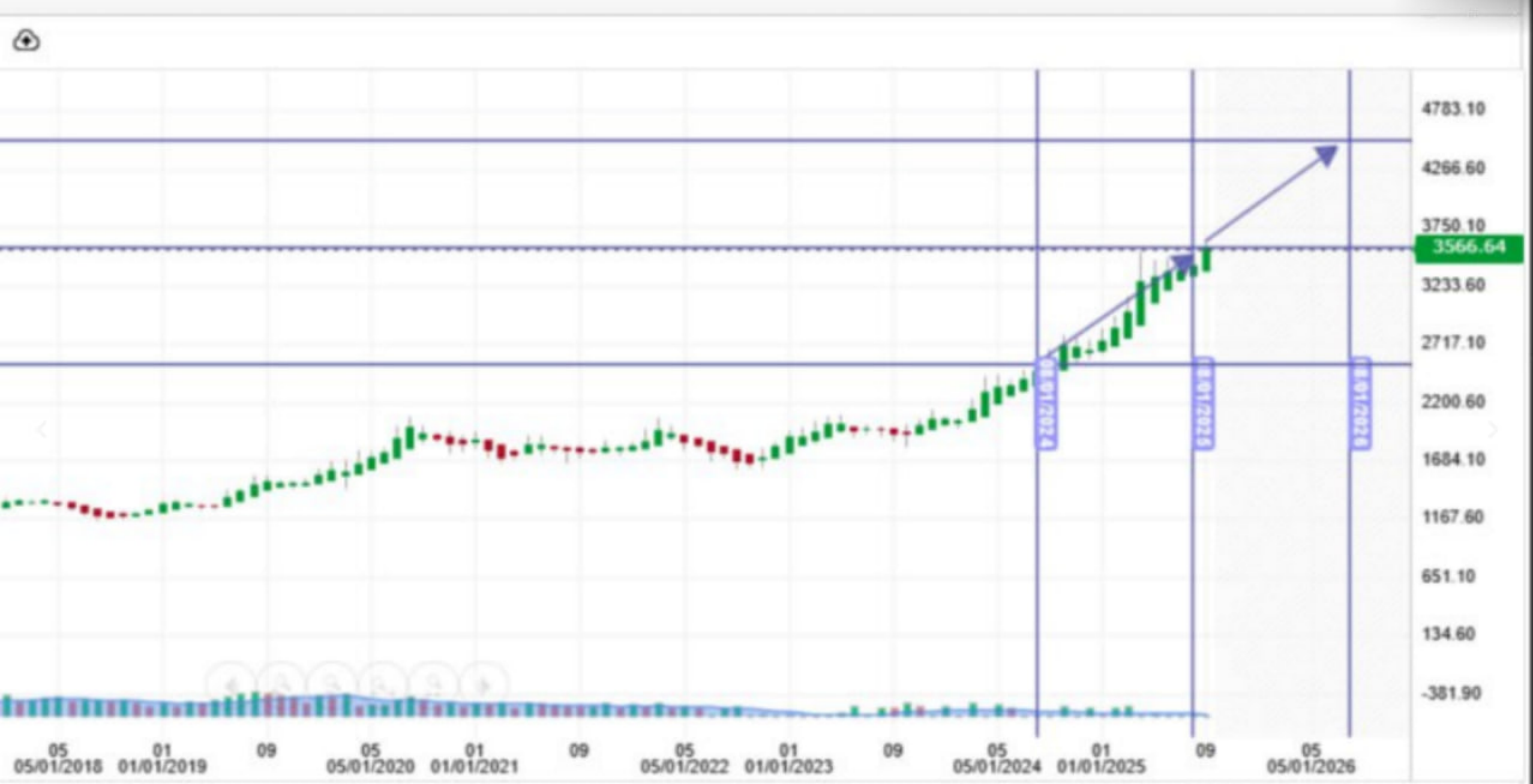
On September 5, 2025, I did my routine gold price chart analysis as usual. At that time, gold was trading around $3,566 per ounce. Using charts from Investing.com (due to having technical issues with my MT4 platform at the time), I performed a complete technical analysis looking at price patterns, support and resistance levels, and market momentum indicators.
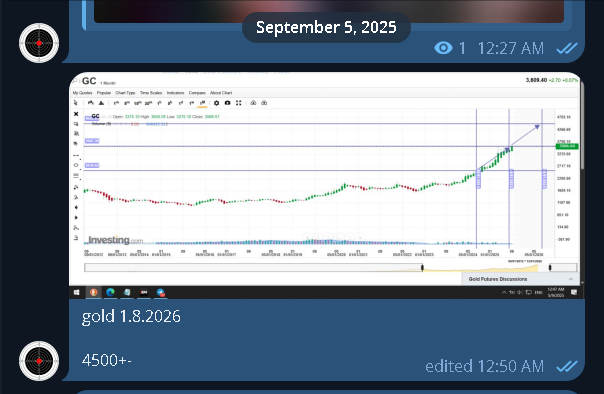
Original gold price analysis chart from September 5, 2025, showing the projection to $4,500 by 8.1.2026
My conclusion was clear: based on the technical patterns and market dynamics I observed, gold had the potential to reach the $4,500 price range by January 8, 2026. I carefully marked this date (8.1.2026) on my analysis chart, recording the key levels and timeframes that supported this projection.
The Error: An Unusual Caption Mistake
As part of my regular routine, I keep complete documentation of all my analyses and findings in my personal Telegram notes for easy reference and tracking. Over years of analysis, this organized approach has provided a reliable record of my market calls for review and performance tracking. On this particular occasion, however, an unusual typing error occurred. Something that had never happened before in my analytical work.
When writing the caption for my chart in Telegram, instead of typing 8.1.2026 (January 8, 2026), I accidentally wrote 1.8.2026 (August 1, 2026). Just two numbers switched. A rare mistake in an otherwise careful process. This single error would temporarily affect my assessment, though my original analysis chart remained perfectly accurate.
The Surprise: Price Target Hit "Too Early"
I continued monitoring the gold market as usual, tracking its progress against my analysis. As we moved into early January 2026, gold began approaching the $4,500 price area. When the price actually hit this target zone, I was genuinely surprised, and not in a good way.
Gold price movement tracking toward the $4,500 target level
According to the date stuck in my head (August 1, 2026), this target was being reached several months too early. This was highly unusual for my analysis methodology. Typically, when my timing is off, it's by a matter of 2-3 weeks at most, not by several months. While I was pleased that the direction and price level were correct, the apparent timing error troubled me significantly.
To be honest, this put me down a bit. I began questioning my analytical approach and wondering if something had fundamentally changed in the market that my methodology wasn't capturing. Had I become rusty after recent months of less intensive analysis? Was my framework still relevant in the current market environment?
The Investigation: Taking Action
Rather than accepting the apparent timing difference, my analytical discipline drove me to investigate further. This wasn't acceptable by my standards. My analysis typically gets timing accuracy within days or weeks, not months. The unusually large difference triggered my review process.
Taking action, I decided to develop an automated script to organize and make my analysis methodology more consistent. The goals were clear:
- Accuracy: Reduce human error and ensure consistent use of my analytical approach
- Efficiency: Make the analysis process faster and simpler
- Discipline: Follow an organized approach every time, without shortcuts or changes
Additionally, I saw this as an opportunity to test and check whether my analysis approach was still relevant and effective after my recent period of reduced activity. The script would provide clear data to confirm or improve my methodology.
Script Performance
I've been testing this script for about a week now, and the results have been very encouraging. The automated analysis has been working very well, with all key targets being achieved with good accuracy. This success boosted my confidence and showed that my core analytical approach remained solid.
The script's success made me curious about something: if my current analysis was performing well, why had that earlier projection seemed so far off in timing? Perhaps it was worth revisiting that original analysis from September 5, 2025.
The Discovery: I Was Right All Along
Today, I decided to re-check my early records and the original analysis about that $4,500 target. I went back to the source. Not just my Telegram notes, but the actual chart I had created on September 5, 2025.
And there it was, clear as day: my original analysis and chart indeed marked 8.1.2026 (January 8, 2026), not 1.8.2026 (August 1, 2026). Gold did hit the $4,500 price area right on schedule in early January 2026, just as my analysis had predicted!
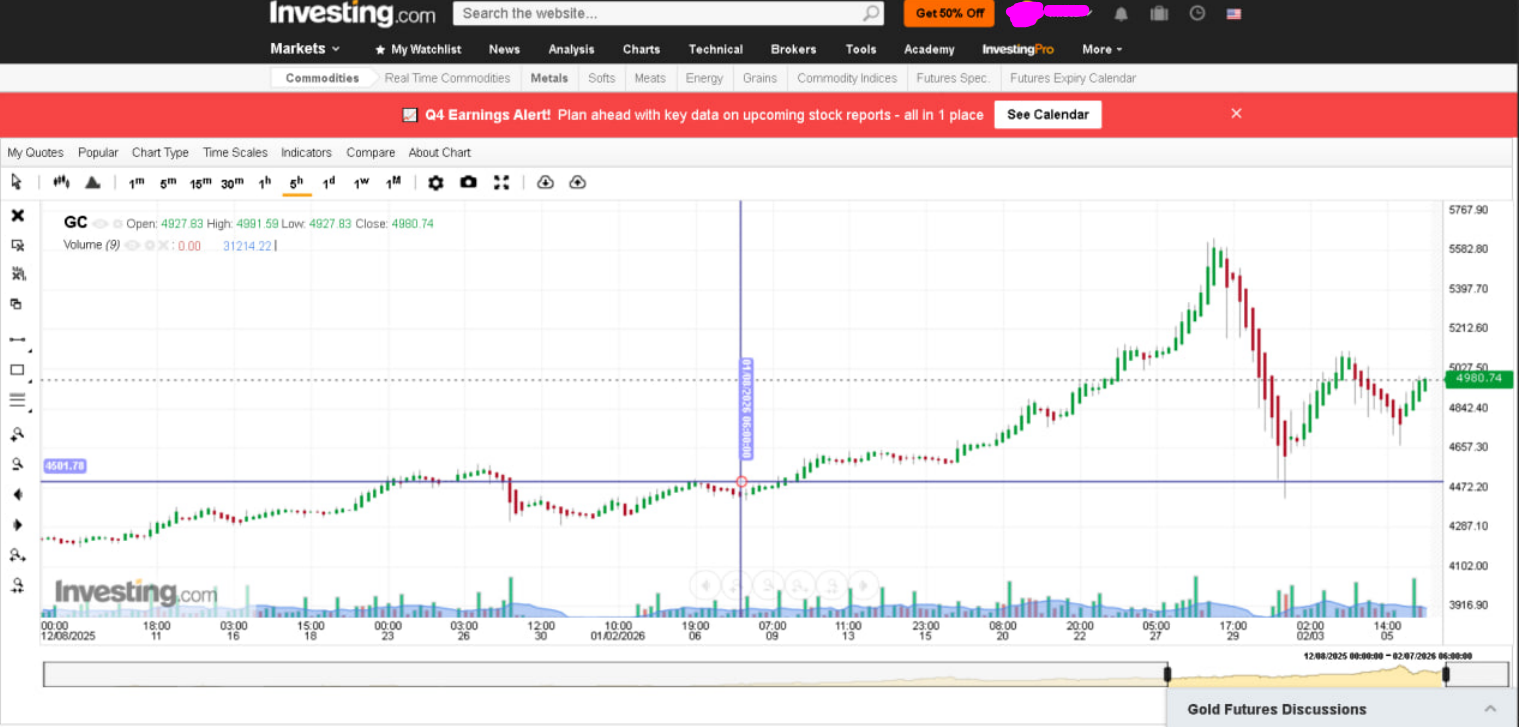
Confirmation of gold hitting the $4,500 target on schedule in January 2026
The realization was both relieving and humbling. My analysis was actually accurate. It was only the caption I wrote in my notes that had the error. The date that had been stuck in my head for months was just a typing mistake in a Telegram message.
Key Lessons
This experience confirmed several key principles that have always guided my analytical work:
1. Careful Checking Catches Errors
My organized approach to reviewing analyses and investigating differences is what revealed the typing error. This incident confirms the importance of keeping primary source documentation as the main record. A practice I've consistently followed throughout my analytical career.
2. High Standards Drive Improvement
The apparent difference didn't sit right with me because it fell outside my typical accuracy range. This concern (based on high analytical standards) drove me to investigate and led to developing a stronger automated analysis tool.
3. Rare Cases Make Systems Stronger
This first-time typing error showed an opportunity to further strengthen my documentation process. The automation script I developed not only prevents such errors but has improved the overall accuracy and efficiency of my analytical approach.
4. Good Analysis Needs Source Records
The fact that my original chart was perfectly accurate (while only the secondary note had the error) shows the value of keeping detailed, primary source documentation. This approach to record-keeping proved its worth when I needed to verify.
Improved Methods
Building upon my already careful analytical approach, I've added more safeguards to further strengthen the process:
- Automated checking between primary analysis files and documentation notes
- Improved script-based analysis tools that keep consistency across all market assessments
- Regular reviews comparing secondary notes against source charts
- Organized checking steps built into the documentation process
Conclusion
My gold analysis worked exactly as planned: from $3,566 on September 5, 2025, to $4,500+ by January 8, 2026. The technical analysis, timeframe projection, and price target were all accurate. The only error was a single typing mistake in a secondary note. The first time this has happened in my analytical work.
This experience confirms the value of keeping high analytical standards and organized checking processes. My discipline in investigating the apparent difference, rather than accepting it, led to finding the typing error and proved the accuracy of my approach. The automated analysis tool I developed has further improved an already strong analytical method, turning a rare mistake into an opportunity for better processes.